This is an automatically translated article.
Post by Master, Doctor Mai Vien Phuong - Gastrointestinal Endoscopy - Department of Medical Examination & Internal Medicine - Vinmec Central Park International General Hospital.
Although data visualization has great research potential to improve the quantitative assessment of gastrointestinal stromal tumors, there are several limitations that challenge its application in everyday clinical practice.
1. What is a gastrointestinal stromal tumor?
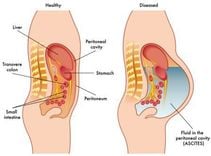
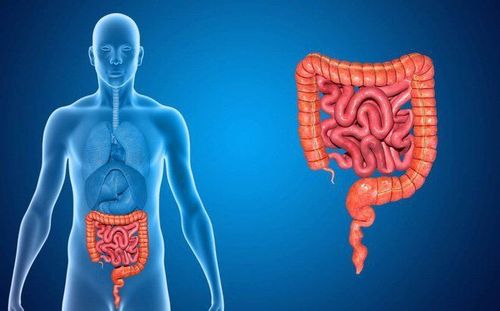
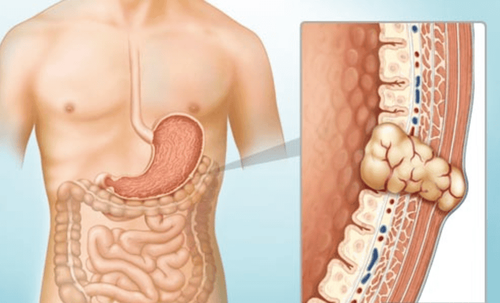
Gastrointestinal stromal tumors (GISTs) are uncommon mesenchymal tumors of the gastrointestinal tract, originating from the interstitial cells of Cajal. Gastrointestinal stromal tumors can arise anywhere along the gastrointestinal tract, most commonly in the stomach (50%-60% of cases) or the small intestine (30%-40%), while they are rare. observed in the esophagus and rectum. All gastrointestinal stromal tumors are potentially malignant with varying degrees of biology. The liver and peritoneum are the most common sites of metastatic or recurrent disease after surgical resection, occurring in approximately 40% of patients. Gastrointestinal stromal tumors are also characterized by distinctive genetic alterations, with 85% of tumors having an activating mutation in the KIT oncogene, while a small number of lesions show mutations in the KIT oncogene. platelet-derived growth α (PDGFRα) or may occasionally lack known mutations.
The introduction of imatinib mesylate, a selective tyrosine kinase inhibitor of KIT and PDGFα receptors, has revolutionized the treatment of gastrointestinal stromal tumors, significantly improving survival of gastrointestinal stromal tumors. patients even in the advanced stage.
2. Classical diagnostic techniques for gastrointestinal stromal tumors
Contrast computed tomography (CT) is the imaging modality of choice for preoperative diagnosis, staging, as well as postoperative follow-up and assessment of treatment response in patients with stromal tumors. gastrointestinal. On contrast-enhanced CT, gastrointestinal stromal tumors (gist) often present with distinctive imaging features, often with large (>5 cm) abdominal mass, heterogeneous enhancement, and number necrosis change. Other imaging findings include the presence of calcifications, ulcers, or cystic degeneration.
Magnetic resonance imaging (MRI) can provide additional information for the evaluation of primary tumors in specific locations and may be preferred for differential diagnosis of liver metastases from other benign liver lesions. .
In clinical practice, predicting the behavior of gastrointestinal stromal tumors is challenging, unless the lesions have metastasized at the time of diagnosis. Although a number of imaging predictors of malignancy have been identified (size, location, boundary, enhancement pattern) and variable correlation with tumor prognosis and survival has been reported. gastrointestinal stromal tissue, small tumors lacking relevant imaging features can still metastasize, making it difficult to predict malignancies.
3. Data analysis and shaping techniques
Datagrammetry is based on mathematical quantification of image heterogeneity, through analysis of the distribution and relationship of pixel intensities in a region of interest (ROI). Datagrammetry can be potentially applied to any type of data-imaging imaging, including ultrasound, CT, MRI, and positron emission tomography/CT, but most studies date are now based on CT or MRI examination. Image acquisition is one of the most important steps in data visualization photography, as the scanning process and specifications can affect the reproducibility of data imaging features. materialization. In particular, the reconstruction algorithm and slice thickness have been shown to largely affect the reproducibility of the CT data visualization features.
Inhomogeneous image acquisition can be problematic for retrospective evaluation of data obtained with different CT or MRI scanners, while prospective studies need to ensure that all patients will be scanned images using standard parameters. It is also important to choose the optimal phase/sequence for image analysis. The pre-contrast image is not affected by the use of contrast, but lesion segmentation is more difficult, especially for smaller tumors that are difficult to distinguish on unenhanced CT. Contrast-enhanced imaging may provide a better assessment of lesion heterogeneity, but denormalized type and duration of contrast administration may represent additional confounding factors. supplement, especially for images obtained on the arterial phase.
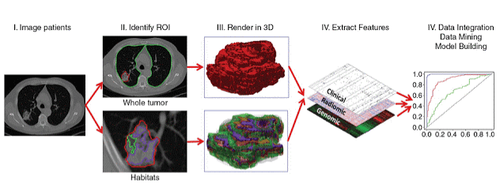
Phép đo tạo hình dữ liệu hóa dựa trên định lượng toán học của sự không đồng nhất của hình ảnh
Radioomics is defined as the high-level extraction of all quantitative or texture features from imaging to decode histopathology and generate new data. data with a large size to extract features.
4. Lesions segmentation is the most important step of the data imaging process
Segmentation can be performed manually by professional data visualization physicians, using semi-automatic or automatic software. Although manual segmentation is time consuming and can vary between readers, it is still considered the gold standard for most data visualization studies. Segmentation is usually performed by plotting the ROI within the tumor margin (Figure 1), avoiding inclusion of any extragastric tissues such as intestinal mucosa, intestinal contents or peritoneal vessels. The ROI can be placed on a single slide (2D ROI) cross-section of the largest tumor or include the entire lesion (3D ROI). Although the latter can capture much of the tissue heterogeneity, its clinical advantage is still debated.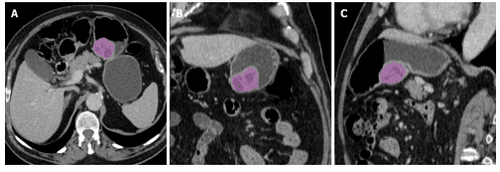
Hình 1. Các ví dụ về phân đoạn tổn thương bằng phần mềm phân tích kết cấu
Only features that do not correlate with significant diagnostic performance are selected for the final data imaging models. The choice of statistical methods and models may depend on many factors such as the assessment of the primary outcome, the number of features, and the number of lesions analyzed. These models can also be combined with other clinical features of the patient to increase predictability. Finally, the scintillation models need to be tested and validated using either an independent internal validation team or an external team. To evaluate the quality of data visualization studies, a score, such as the data visualization quality score developed by Lambin et al., has been proposed, which measures the 16 major components of data visualization. data modeling workflow.
5. Using data visualization techniques in the diagnosis of gastrointestinal stromal tumors GIST
As of May 2020, all scans of gastrointestinal stromal tumors were performed in the retrospective community and only four were multicenter. The number of gist gastrointestinal stromal tumors included varied widely from 15 to 440 lesions. All but one of the gist gastrointestinal stromal imaging studies used CT imaging to extract features, whereas only one study evaluated MRI.
On CT studies, angiographic analysis is best performed at the venous stage (48%), followed by the arterial phase (38%) and pre-contrast imaging (14%). ) (Figure 2). None of the studies included a delayed phase in the datagram evaluation. The first, second and third features were extracted in 80%, 67% and 20% of the studies, respectively. Volumetric analysis (3D ROI) was performed in 60% of cases, while 2D ROI was placed in 47% of cases. Only one study compared the accuracy of 2D and 3D ROI in GIST, reporting excellent agreement between the two segmentation methods.
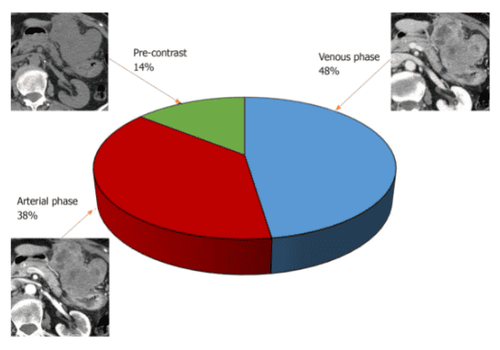
Hình 2. Biểu đồ cho thấy tần suất của các giai đoạn hình ảnh chụp cắt lớp vi tính trong các nghiên cứu về khối u mô đệm đường tiêu hóa bằng tạo hình dữ liệu hóa.
6. Limitations and future development directions
Although data visualization has great research potential to improve the quantitative assessment of tumors, there are several limitations that challenge its application in everyday clinical practice. Methodological standardization is a key issue for data visualization. Differences in image acquisition, feature extraction, and data visualization software challenge the comparison of studies as well as the repeatability or applicability of scintigraphic models in different populations.
All the currently published studies on data visualization of gastrointestinal stromal tumors are retrospective and most have been performed in single centers. The lack of standardization in the acquisition of CT and MRI is another major problem for the evaluation of gastrointestinal stromal tumors by data imaging. This is closely related to the rarity of GIST gastrointestinal stromal tumors compared with other neoplasms, requiring the collection of imaging studies over a long period of time. Furthermore, specific histopathological features of gastrointestinal stromal tumors, such as mitotic counts and mutational status, require pathological diagnosis through resection slides as reference criteria. projection for data modeling studies. The assessment of response to treatment with tyrosine kinase inhibitors also requires further investigation. Thus, response to targeted therapy can occur even without tumor reduction. Therefore, the Choi criterion, based on CT impairment value measurements, was accepted to assess treatment response in patients on targeted therapy. Additional values of scintigraphy in the imaging assessment of response to treatment are currently unexplored and may be investigated in future studies.
More potential multicenter studies will be needed to confirm the optimal diagnostic performance of the data visualization models provided by the retrospective analysis. Future works are also warranted to optimize and standardize software radiomics, image acquisition, feature extraction, and model analysis.
Please dial HOTLINE for more information or register for an appointment HERE. Download MyVinmec app to make appointments faster and to manage your bookings easily.
References: Cannella R, La Grutta L, Midiri M, Bartolotta TV. New advances in scintigraphy of gastrointestinal stromal tumors. World J Gastroenterol 2020; 26 (32): 4729-4738 [PMID: 32921953 DOI: 10.3748 / wjg.v26.i32.4729 ]